Excerpts from The World Population Prospects 2022 (United Nations)
The details are all available at https://population.un.org/wpp/
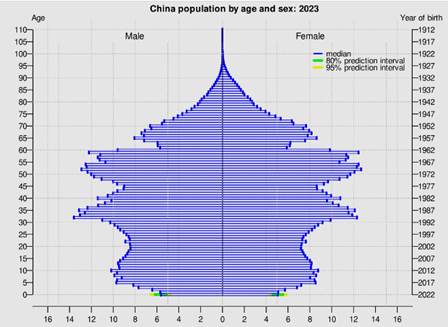
This excerpt set focuses only on the aging aspects and the population pyramid.
The world’s
population continues to grow, but the pace of growth is slowing down. In 2020,
the growth rate of the global population fell under 1 per cent per year for the
first time since 1950. The latest projections by the United Nations suggest
that the world’s population could grow to around 8.5 billion in 2030 and 9.7
billion in 2050; it is projected to reach a peak of around 10.4 billion people
during the 2080s and to remain at that level until 2100. The world’s population
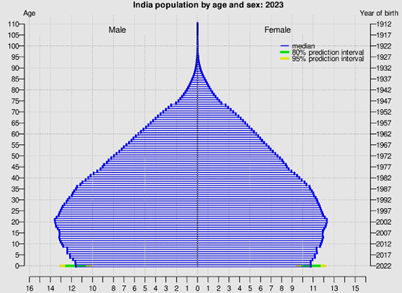
is projected to reach 8 billion on 15 November 2022, and India was projected to
surpass China as the world’s most populous country in 2023.
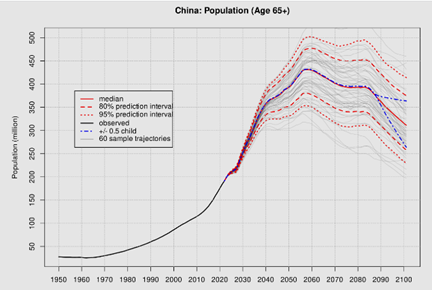
The population
of older persons is increasing both in numbers and as a share of the total. The
population above age 65 years is growing more rapidly than the population below
that age. As a result, the share of global population at ages 65 and above is projected
to rise from 10 per cent in 2022 to 16 per cent in 2050. At that point, it is
expected that the number of persons aged 65 years or over worldwide will be
more than twice the number of children under age 5 and about the same as the
number under age 12.
More and more
countries have begun to experience population decline. Fertility has fallen
markedly in recent decades for many countries. Today, two-thirds of the global
population lives in a country or area where lifetime fertility is below 2.1
births per woman, roughly the level required for zero growth in the long run
for a population with low mortality. The populations of 61 countries or areas
are projected to decrease by 1 per cent or more between 2022 and 2050, owing to
sustained low levels of fertility and, in some cases, elevated rates of
emigration.
International migration is having important impacts on population trends for some countries. For high-income countries between 2000 and 2020, the contribution of international migration to population growth (net inflow of 80.5 million) exceeded the balance of births over deaths (66.2 million). Over the next few decades, migration will be the sole driver of population growth in high-income countries. By contrast, for the foreseeable future, population increase in low-income and lower-middle-income countries will continue to be driven by an excess of births over deaths.
Population growth is caused in part by declining levels of mortality, as reflected in increased levels of life expectancy at birth. Globally, life expectancy reached 72.8 years in 2019, an increase of almost 9 years since 1990. Further reductions in mortality are projected to result in an average longevity of around 77.2 years globally in 2050.
Following a drop in mortality, population growth continues so long as fertility remains at high levels. When fertility begins to fall, the annual rate of growth starts to drop. In 2021, the average fertility of the world’s population stood at 2.3 births2 per woman over a lifetime, having fallen from about 5 births per woman in 1950. Global fertility is projected to decline further to 2.1 births per woman by 2050.

The world’s two
most populous regions in 2022 were Eastern and South-Eastern Asia, with 2.3
billion people, representing 29 per cent of the global population, and Central
and Southern Asia, with 2.1 billion (26 per cent) (figure I.2 and table
I.1). China and India accounted for the largest populations in these regions,
with more than 1.4 billion each in 2022.
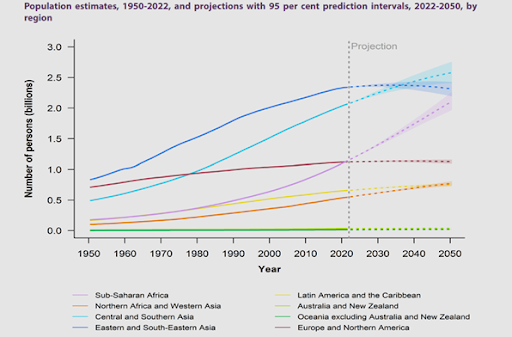
Europe and
Northern America is projected to reach its peak population size and to begin
experiencing population decline in the late 2030s due to sustained low levels
of fertility, which has been below 2 births per woman since the mid-1970s and,
in some countries, high emigration rates.
Between 2022 and 2050, the population of sub-Saharan Africa is expected to almost double, surpassing 2 billion inhabitants by the late 2040s. With average fertility levels remaining close to 3 births per woman in 2050, sub-Saharan Africa is projected to account for more than half of the growth of the world’s population between 2022 and 2050. In 2022, the size of the population in this region was growing at an annual rate of 2.5 per cent, the highest among all eight regions or more than three times the global average of 0.8 per cent per year.
Central and Southern Asia is expected to become the most populous region in the world by 2037 as the population of Eastern and South-Eastern Asia could start declining by the mid-2030s.
More than half of the projected increase in the global population between 2022 and 2050 is expected to be concentrated in just eight countries: the Democratic Republic of the Congo, Egypt, Ethiopia, India, Nigeria, Pakistan, the Philippines and the United Republic of Tanzania. The populations of the Democratic Republic of the Congo and the United Republic of Tanzania are expected to grow rapidly, between 2 and 3 per cent per year over the 2022-2050 period. Disparate population growth rates among the world’s largest countries will change their ranking by size: for example, India is projected to surpass China as the world’s most populous country in 2023
The population of 61 countries or areas are projected to decrease by 1 per cent or more between 2022 and 2050. In countries with at least half a million population, the largest relative reductions in population size over that period, with losses of 20 per cent or more, are expected to take place in Bulgaria, Latvia, Lithuania, Serbia and Ukraine. China is expected to experience an absolute decline in its population as early as 2023.
Historically, changes in a country’s population size have been a direct consequence of a process known as the demographic transition in which gradually decreasing levels of mortality and fertility lead to longer lives and lower average number of births per woman. The transition often unfolds in a series of stages, during which population growth first accelerates and then slows down. This transition is accompanied by changes in the distribution of the population by age with a gradual increase in the share of older population. Due to the reduction of fertility in the intermediate stage of the transition, the relative size of successive birth cohorts begins to decline. Since the decline at younger ages is not immediately counterbalanced by increases at older ages, the share of the population in the working ages grows temporarily relative to the combined shares at younger and older ages (Lee and Mason, 2006). The growth of the share of the population at the working ages can provide an opportunity for accelerated economic growth and social development known as the “demographic dividend”. During this phase, overall dependency ratios fall, making more resources available to increase investments in education, health, employment, social protection, pension schemes, etc., thereby fostering short and medium-term economic growth and well-being. The population of working-age adults remains relatively large for several decades until eventually, population ageing generates a substantial increase in the percentage of persons at older ages. In many countries in the advanced stages of the demographic transition, this demographic window of opportunity has already closed. Countries that are still at an early stage of the demographic transition, however, have an opportunity to maximize the benefits of the dividend by investing in human capital formation. While the demographic circumstances underlying the dividend are conducive to rapid economic growth on a per capita basis, reaping its potential benefits requires significant investments in education and health, progress towards gender equality and the availability of gainful employment.
Worldwide, persons aged 65 years or over outnumbered children under age five for the first time in 2018. In 2022, there were 771 million people aged 65 years or over globally, 3 times more than the size in 1980 (258 million). The older population is projected to reach 994 million by 2030 and 1.6 billion by 2050. As a result, by 2050 there will be more than twice as many persons aged 65 or older than children under 5 globally, whereas the number of persons aged 65 years or over globally will be almost the same as the number of children under age 12. While in some countries the rapid growth of the older population results mainly from sustained high levels of fertility in the past, the continued reduction of premature mortality of successive generations is the main driver in other countries. The proportion of persons aged 65 or over is projected to increase globally between 2022 and 2050. At the world level in 2022, approximately 10 per cent of people are aged 65 or over (table I.2). The proportion of older persons in the world is projected to reach nearly 12 per cent in 2030 and 16 per cent in 2050. Europe and Northern America had the largest proportion of older population in 2022, with almost 19 per cent aged 65 or over, followed by Australia and New Zealand (16.6 per cent). Both regions are continuing to age further. Projections indicate that by 2050 one in every four persons in Europe and Northern America could be aged 65 years or over
Populations in other regions are also projected to age significantly over the next several decades. For Latin America and the Caribbean, the share of the population aged 65 years or over could increase from 9 per cent in 2022 to 19 per cent in 2050. Similarly, the proportion aged 65 or over in Eastern and South-Eastern Asia is expected to double from around 13 per cent in 2022 to 26 per cent in 2050.

Starting in the
1960s, fertility levels in Eastern and South-Eastern Asia declined more rapidly
compared to Europe and other regions where the decline happened earlier, owing
both to the rapid pace of socioeconomic development and to the effectiveness of
state-sponsored family planning programmes in supporting changing patterns of
childbearing. Since 2018, Latin America and the Caribbean joined the list of
regions where fertility has fallen below 2 births per woman over a lifetime.
In the high-
and low-fertility scenarios, the future fertility level for each country or
area is assumed to be consistently higher or lower than in the medium scenario
by exactly one half (0.5) of a birth per woman, on average, while retaining the
same assumptions with respect to mortality and international migration. As
illustrated in figure III.3, the trends in global population size associated
with the high- and low-fertility scenarios diverge considerably from the
trajectory of the medium scenario and imply a range of future outcomes that is
much broader than the prediction intervals of the probabilistic analysis. The
probabilistic assessment of projection uncertainty suggests that the range
between the high- and lowfertility scenarios may be implausibly large,
especially in the latter decades of the current century. The medium scenario of
global trends is derived by aggregating the “best guess” projections for
individual countries and areas. Although a deviation of half (0.5) of birth
between actual and projected fertility levels is entirely plausible for a given
country or area in a given year, it is unlikely that this would be the case for
all countries and areas and for all future years as implied by the traditional
high- and low-fertility scenarios of the United Nations population projections
(Gerland and others, 2014).

The past has
shown that poorer countries tend to leapfrog and change trends fast. Hence, the
fertility could very well drop faster in Sub Saharan Africa and South Asia than
what is being anticipated. This would likely result in higher aging and lower
working age populations.

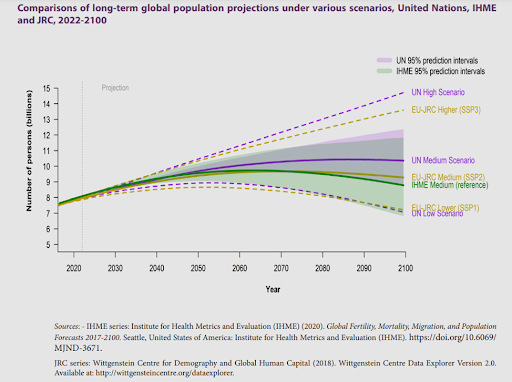
Besides the
probabilistic and deterministic population projections released by the United
Nations, other institutions produce long term population projections. The
latest sets of three shared socio-economic pathways (SSPs) published by the
Joint Research Center of the European Commission (JRC) outline alternative
scenarios illustrating a broad range of possible futures (European Commission,
Joint Research Center, 2018). The first of these scenarios, SSP1, labelled
‘Sustainability/Rapid Social Development’, assumes an acceleration of the
demographic transition through sustained investments in education and health
that would contribute to future low levels of mortality and fertility. The
second scenario, SSP2, labelled ‘Continuation/Medium Population Scenario’, is
considered as the most likely future based on trends of recent decades and
assumes a medium pathway in future fertility, mortality and education. The last
scenario, SPP3, labelled ‘Fragmentation/Stalled Social Development’, is
characterized by rapid population growth accompanied by low education, and high
mortality and fertility. Global population levels are lowest in SSP1, peaking
at 8.7 billion between 2050 and 2060, and declining to 7.3 billion by 2100. This
is broadly consistent with the United Nations low-fertility scenario. Under
SSP2, the middle-of-the-road scenario, the future population would peak around
9.7 billion in 2070. This figure is still lower than the United Nations medium
scenario of around 10.4 billion in 2100. Finally, SSP3 shows continued global
population growth through to the end of the century, reaching 13.6 billion by
2100. SSP3 is higher than the United Nations medium scenario, but still below
the high-fertility scenario (figure III.4). In sum, at the global level, the
lowest SSP trajectory lies close to the United Nations lowfertility scenario.
However, while the traditional “low- and high-fertility” scenarios of the
United Nations may be plausible for high-fertility countries individually, they
depict rather unlikely outcomes for regional and global aggregates (Gerland and
others, 2014).
Alternative long-term population projections have also been undertaken by the Institute of Health Metrics and Evaluation (IHME). In its recent projections, IHME projected that the global population will reach 8.8 billion in 2100 with a range of 6.8 billion to 11.8 billion. The main difference between the projections released by IHME and the United Nations lies in the assumptions on the future level of fertility. IHME projects that the global level of fertility will decline faster than under the United Nations medium scenario. According to IHME, the average number of children per woman will decline to 1.66 children at the end of the century while the United Nations projects fertility to be around 1.84 at the same date.
For example,
with a total fertility rate of 1.7 births per woman in 2100, IHME projects a
faster decline of fertility in sub-Saharan Africa than the United Nations
medium scenario, which projects a total fertility rate of 2.0 at the end of the
century (figure III.5). This difference of 0.27 births per woman in 2100
results in a population that is 378 million lower than projected by the United
Nations medium scenario. At the national level, the differences in the
fertility rate between the two sets of projections by 2100 can be more
substantial, with 1.79 births per woman instead of 2.22 in Niger or 1.33 births
per woman instead of 1.87 in Ethiopia, for example. In India, IHME projects a
total fertility rate of 1.29 births per woman in 2100 instead of 1.69 in
the United Nations medium scenario, resulting in a population that is 433
million smaller than according to the United Nations projections at the end of
the century.
The projected differences between India and China


Comments
Post a Comment